Status Dashboard
Kahuna serves a read-only operator dashboard at the HTTP root by default:
http://127.0.0.1:8081/
https://127.0.0.1:8082/
Use it for a quick view of one node: readiness, local role, hosted partitions, total partitions, replication factor, storage backend, WAL backend, backup status, process version, uptime, heap size, thread count, persistence backlog, and selected engine metrics.
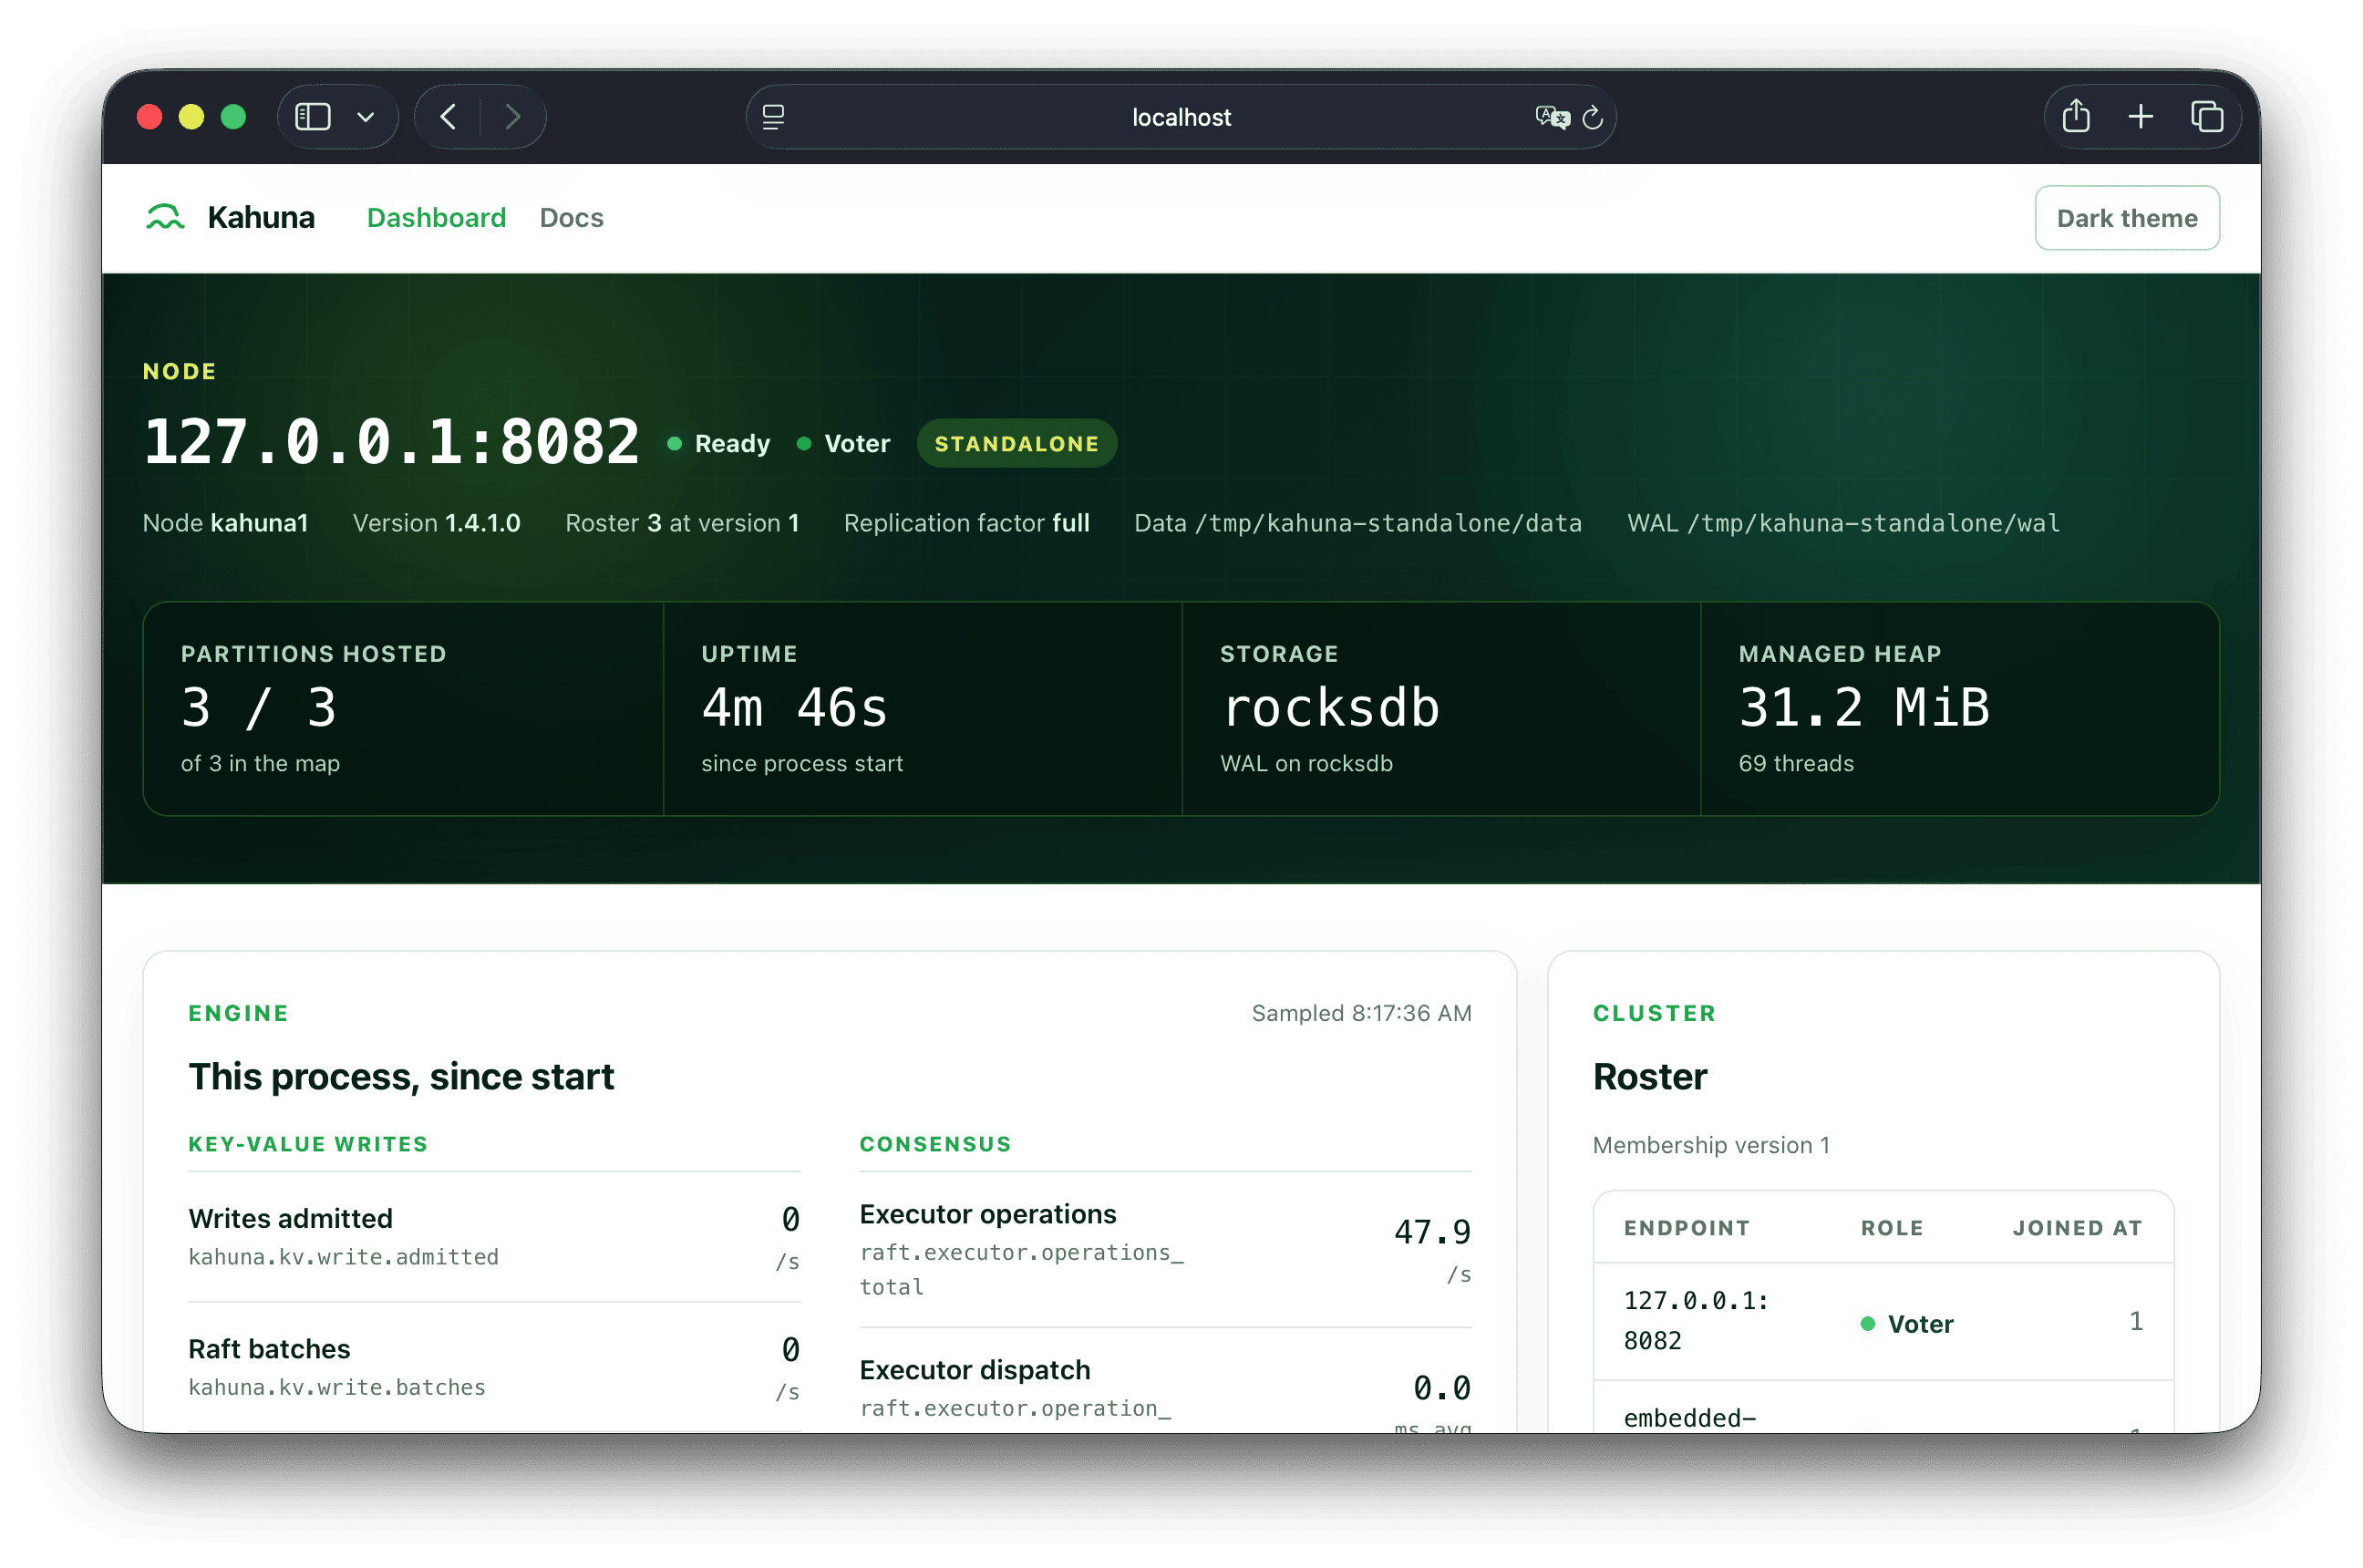
The dashboard is safe to leave enabled on a trusted operator network because it does not mutate cluster state. It never starts backups, restores data, changes placement, moves leaders, splits ranges, or opens transactions. Protect the HTTP/HTTPS ports with your normal network controls.
Configuration
kahuna-server \
  --dashboard-refresh-seconds 10 \
  <other-server-options>
| Option | Default | Meaning |
|---|---|---|
--disable-dashboard | disabled | Disable the browser dashboard. The root path returns plain Kahuna.Server. |
--dashboard-refresh-seconds | 5 | Browser polling interval in seconds. Values are clamped from 1 to 300. |
JSON Endpoints
Automation can read the same node-local data without scraping the page:
curl http://127.0.0.1:8081/v1/dashboard/summary
curl http://127.0.0.1:8081/v1/dashboard/metrics
/v1/dashboard/summary reports node identity, readiness, role, partition counts, membership version, replication factor, storage paths, backup status, version, uptime, heap bytes, thread count, and refresh interval.
/v1/dashboard/metrics reports a curated subset of Kahuna and Kommander metrics for browser display, including the persistence backlog gauges used by the write backpressure gate. For full production telemetry, export the Kahuna and Kommander meters through your observability stack.